Blast Radius
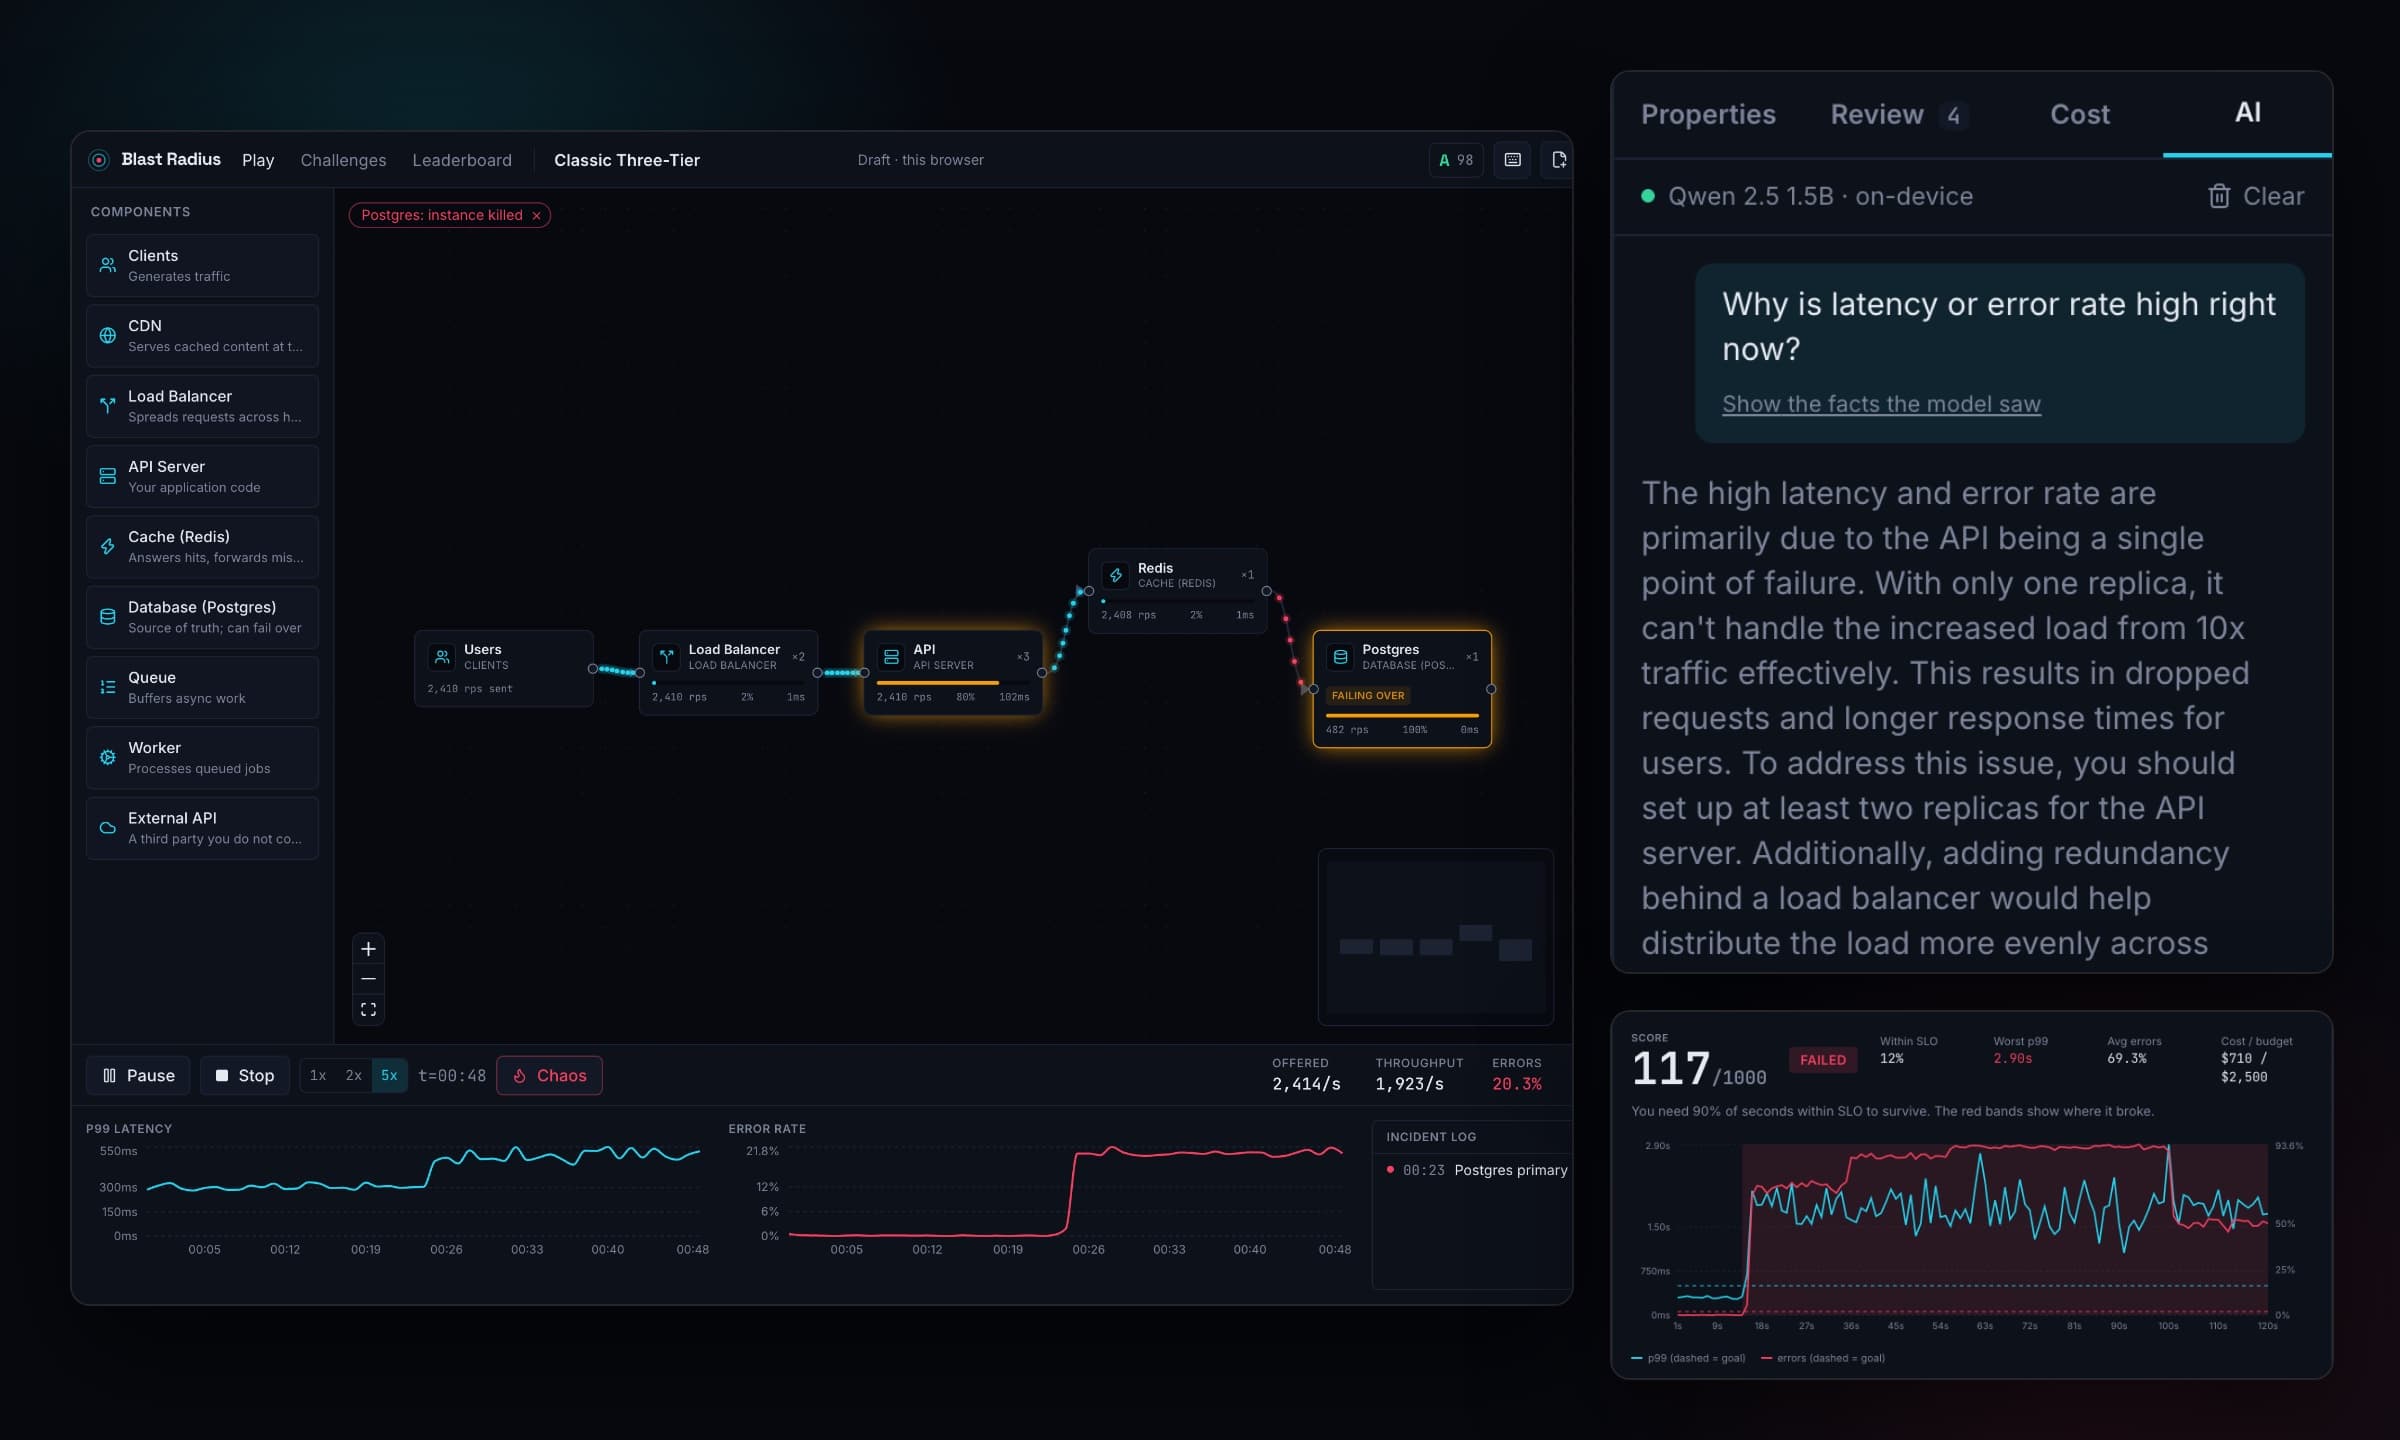
An architecture diagram that runs — break it, score it, and ask an AI on your own GPU why it failed.
- Role
- Solo — product, scenarios, testing; code AI-assisted
- Year
- 2026
- Status
- Deployed
The problem
Every system design conversation ends at a whiteboard, and whiteboards don’t fail. Nobody sees that the single Postgres box takes the whole site down, that the cache in front of it turns a Redis outage into a database stampede, or that “add retries” turns a slowdown into an outage. Engineers learn those in production incidents.
I wanted somewhere to learn them in thirty seconds: draw the system, press Play, break it, and watch the blast radius spread — then get a score you can’t fake and an explanation you don’t pay for.
How it works
React and React Flow on the front, a pure TypeScript engine underneath, an open model on WebGPU for the analyst, and Supabase for accounts, saved designs and the verified leaderboard.
Your browser
Editor
drag, connect, break
Engine
seeded, rates + samples
Review + score
rules, SLOs, budget
AI analyst
WebLLM, your GPU
Supabase — only what you choose to save or submit
Postgres + RLS
designs, scores
submit-run
re-runs the same engine
Clients can't write scores; the server recomputes them.
Hugging Face
model weights, once
Four decisions worth defending
Simulate, don't animate — and seed it
Animated diagrams move dots at a fixed rate, so a dot reaching a dead database looks like one reaching a healthy one. Here every 100 ms request rates flow through the graph, components saturate and drop, latency climbs along a queueing curve, and about 200 sampled requests measure the real p99. The random source is seeded, so the same design and scenario always produce the same numbers — which is what makes the tests exact and the leaderboard verifiable.
The server re-runs every score
Anything the browser computes, the player can change. So the browser can’t write a score at all: the scores table has row-level security with no insert policy. A Supabase edge function loads the submitted design with the player’s own session, re-runs the scenario with a Deno copy of the same engine, and stores the result. A test fails CI if that copy drifts from the browser’s by a single byte.
Rules grade it; a local AI explains it
A grade that changes when you ask twice teaches the wrong lesson, so the A–F review is rules: graph analysis for single points of failure, a headless run for bottlenecks. The AI came second and got a narrower job. A small open model runs on the visitor’s GPU through WebLLM — no API key, no bill, nothing sent — and it is given a fact sheet built from the engine’s own output, so it quotes real numbers instead of inventing them.
Share videos rendered in the tab, not on a server
The diagrams people share are posters with motion, so any design exports as a 16:9, 1:1 or 9:16 MP4. Screen recording runs in real time, drops frames and gives WebM, which X refuses; a render server means a queue, a bill and designs leaving the browser. Instead a canvas renderer draws each frame for a time t and WebCodecs encodes H.264 faster than real time. The layout and timing are pure functions with their own tests, and the live preview calls the same draw function as the encoder, so what you see is what you post.
Measured, not assumed
1000 = 1000
the score the browser showed and the score the server recomputed, on the live project. A forged insert from the client was refused by Postgres.
5 / 5
challenges a reference design survives within budget — while 40 fixed replicas fails Black Friday on cost, so money alone doesn't win.
96 + 29
unit tests in about 7 seconds (93% coverage of the engine and drawing rules), plus 29 checks driving the production build in headless Chrome under the production CSP, including rendering a video.
0
requests to hosts outside the allow-list during a full browser run. The design and the AI conversation never leave the tab.
The test suite was attacked before it was trusted. It passed every test on its first run, so I broke the engine on purpose: a dead cache that failed every request instead of passing it to the database. The suite still passed — the test checked database load, not whether requests succeeded. It checks both now, and re-breaking it makes it fail.
What balancing the game found
A challenge is a test with a score attached, and the first version of every challenge was wrong in one direction or the other.
A challenge everyone could win. A single-server design “survived” The Slow Provider because it had no provider to slow down. Scenarios now declare the components they need, and a design without them can’t enter.
A challenge no one could win. The autoscaler added one replica every ten seconds — too slow for a 10x ramp at any budget. It now tracks its utilization target and adds what’s needed, and a test proves a winning design exists for every scenario.
Paused that looked like running. SVG animations run on the browser’s clock, not React’s, so particles kept flowing after Pause. They freeze now, there’s a real Stop button, and the browser test compares particle positions while paused.
The lesson that stuck: balance is a correctness property. An unwinnable challenge and a free win are both bugs, and both were invisible until a test asserted that a winning design exists and that money alone doesn’t win.
There is a great deal more
The full study covers the rest: the honest trade-offs table, all ten decisions with the options that lost, every bug and what found it, the testing strategy, and what is deliberately not built.